
Dashboard
The Overview (/) is the live home screen. Everything on it renders from the active
inverter’s capabilities — nothing is
hard-coded per vendor, so sections appear only for the subsystems your inverter actually
has. Live values arrive over a WebSocket at 1 Hz.
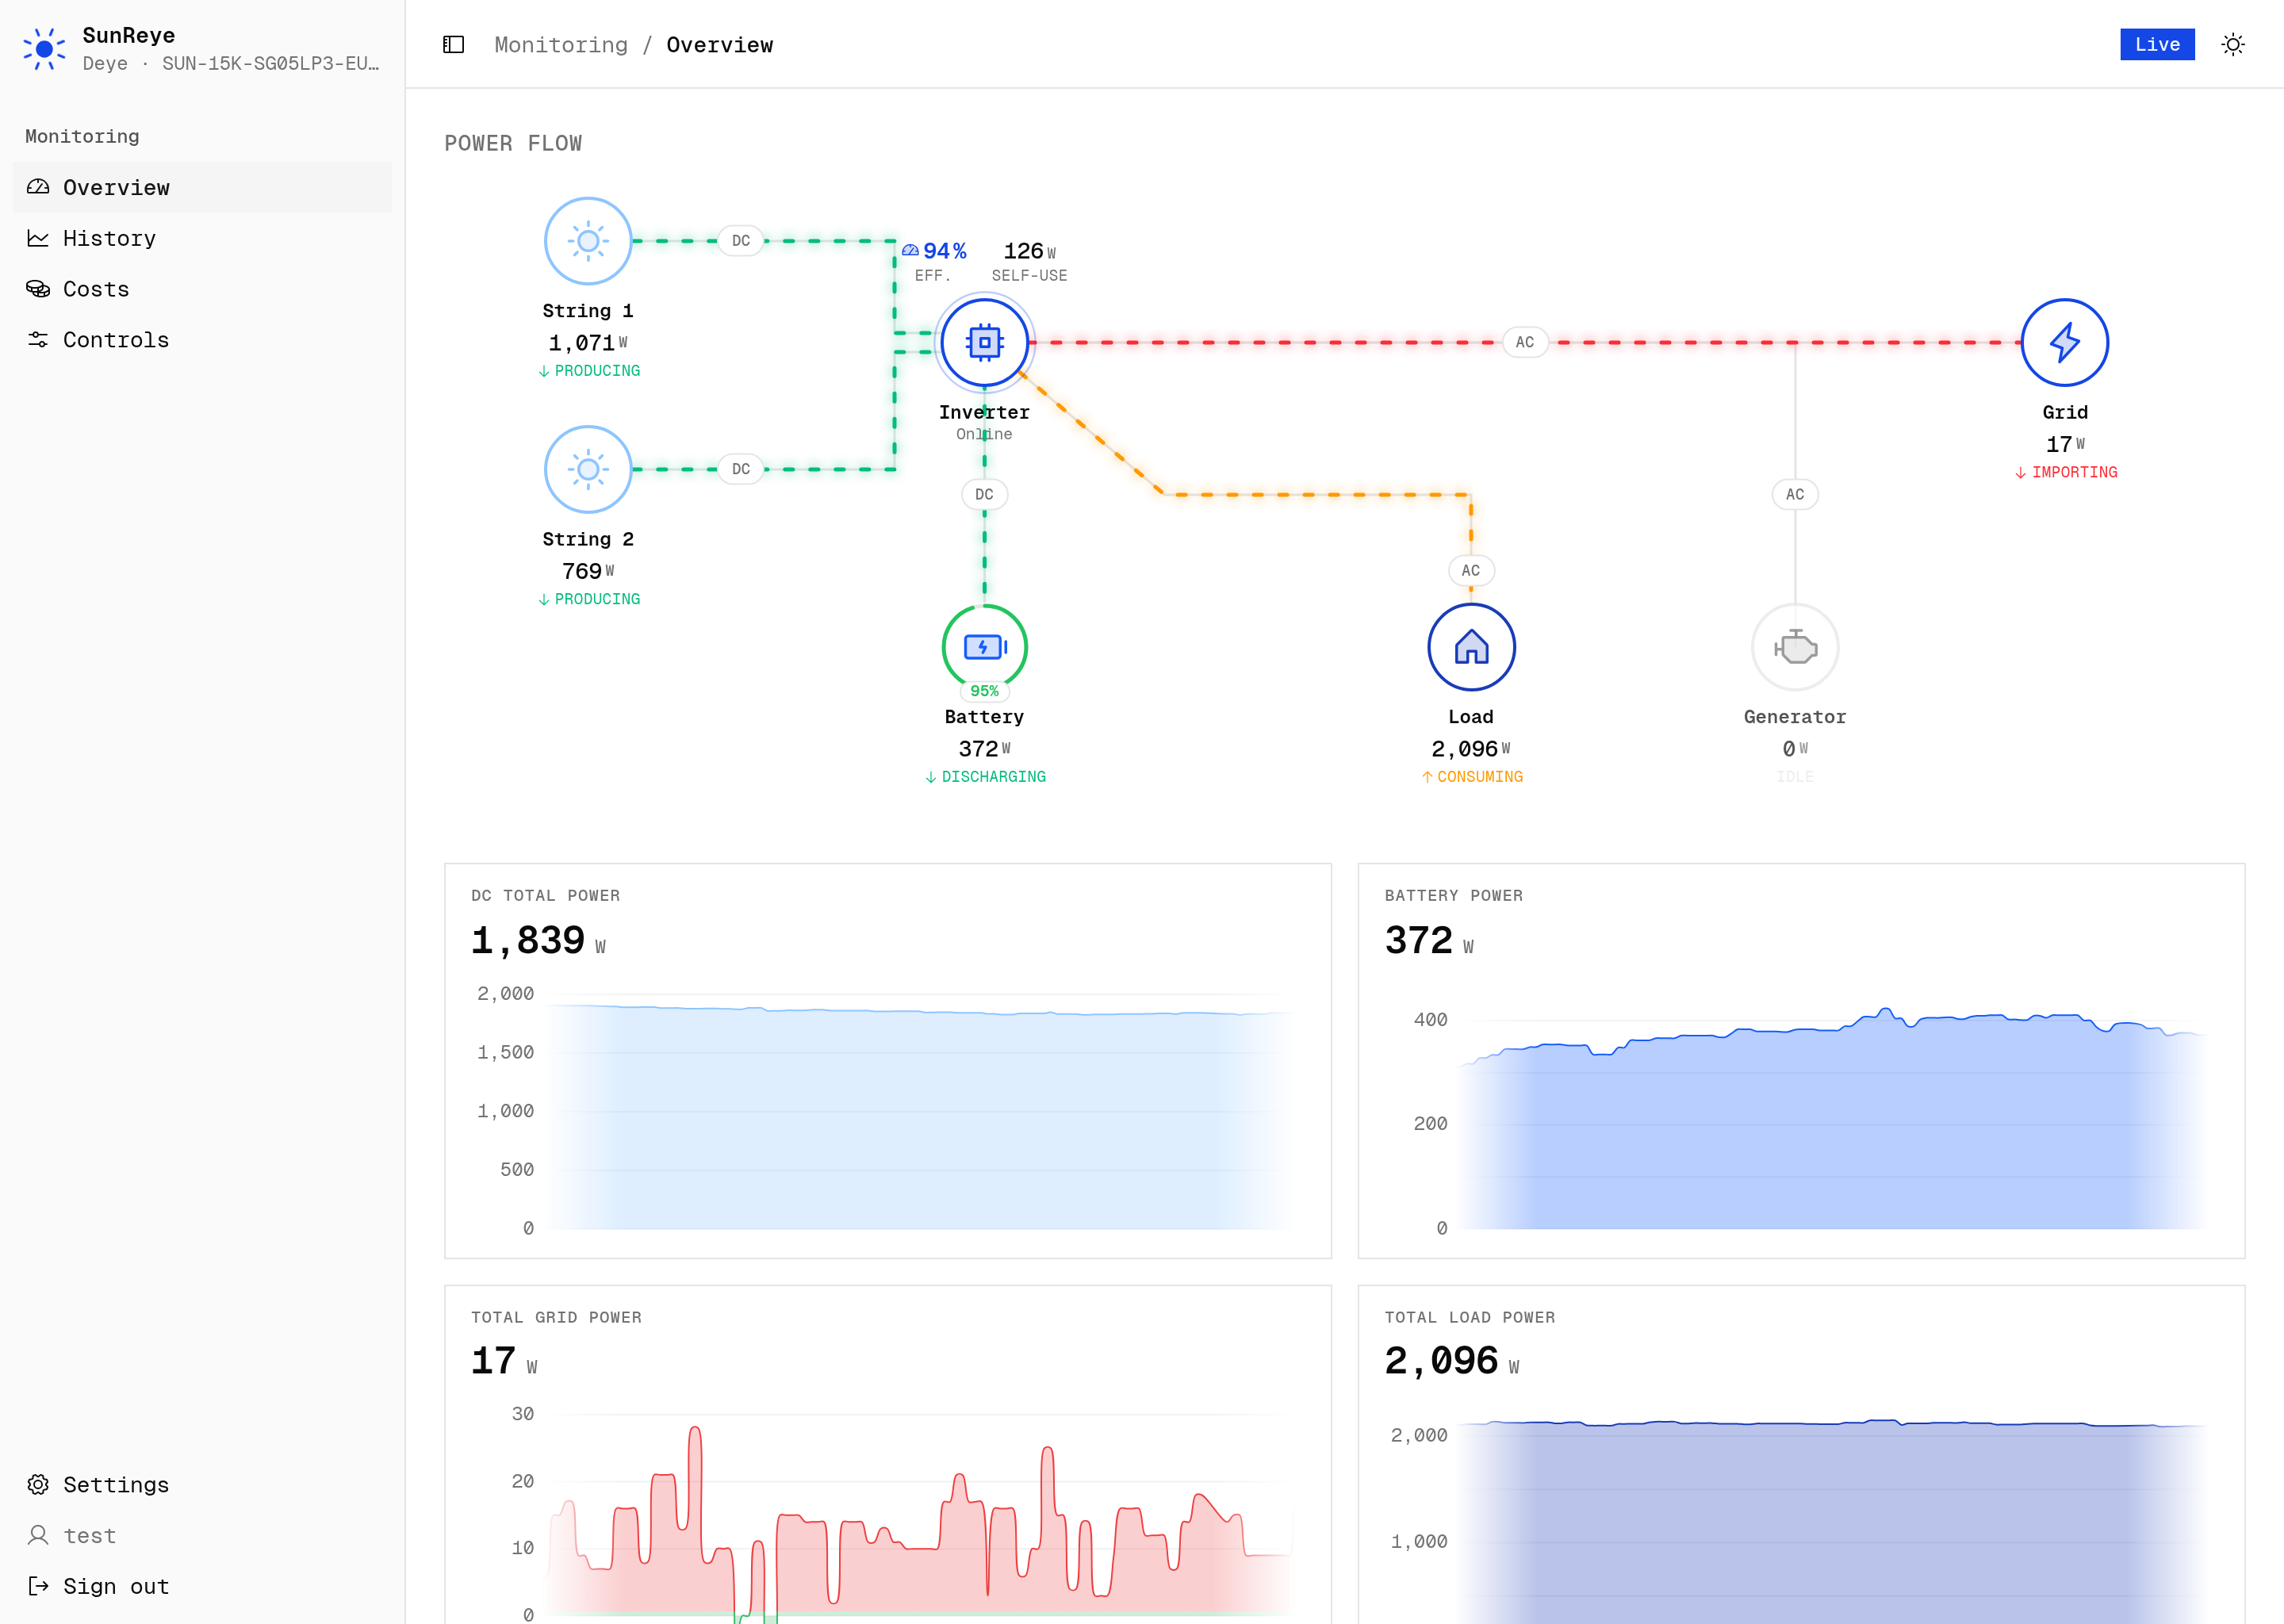
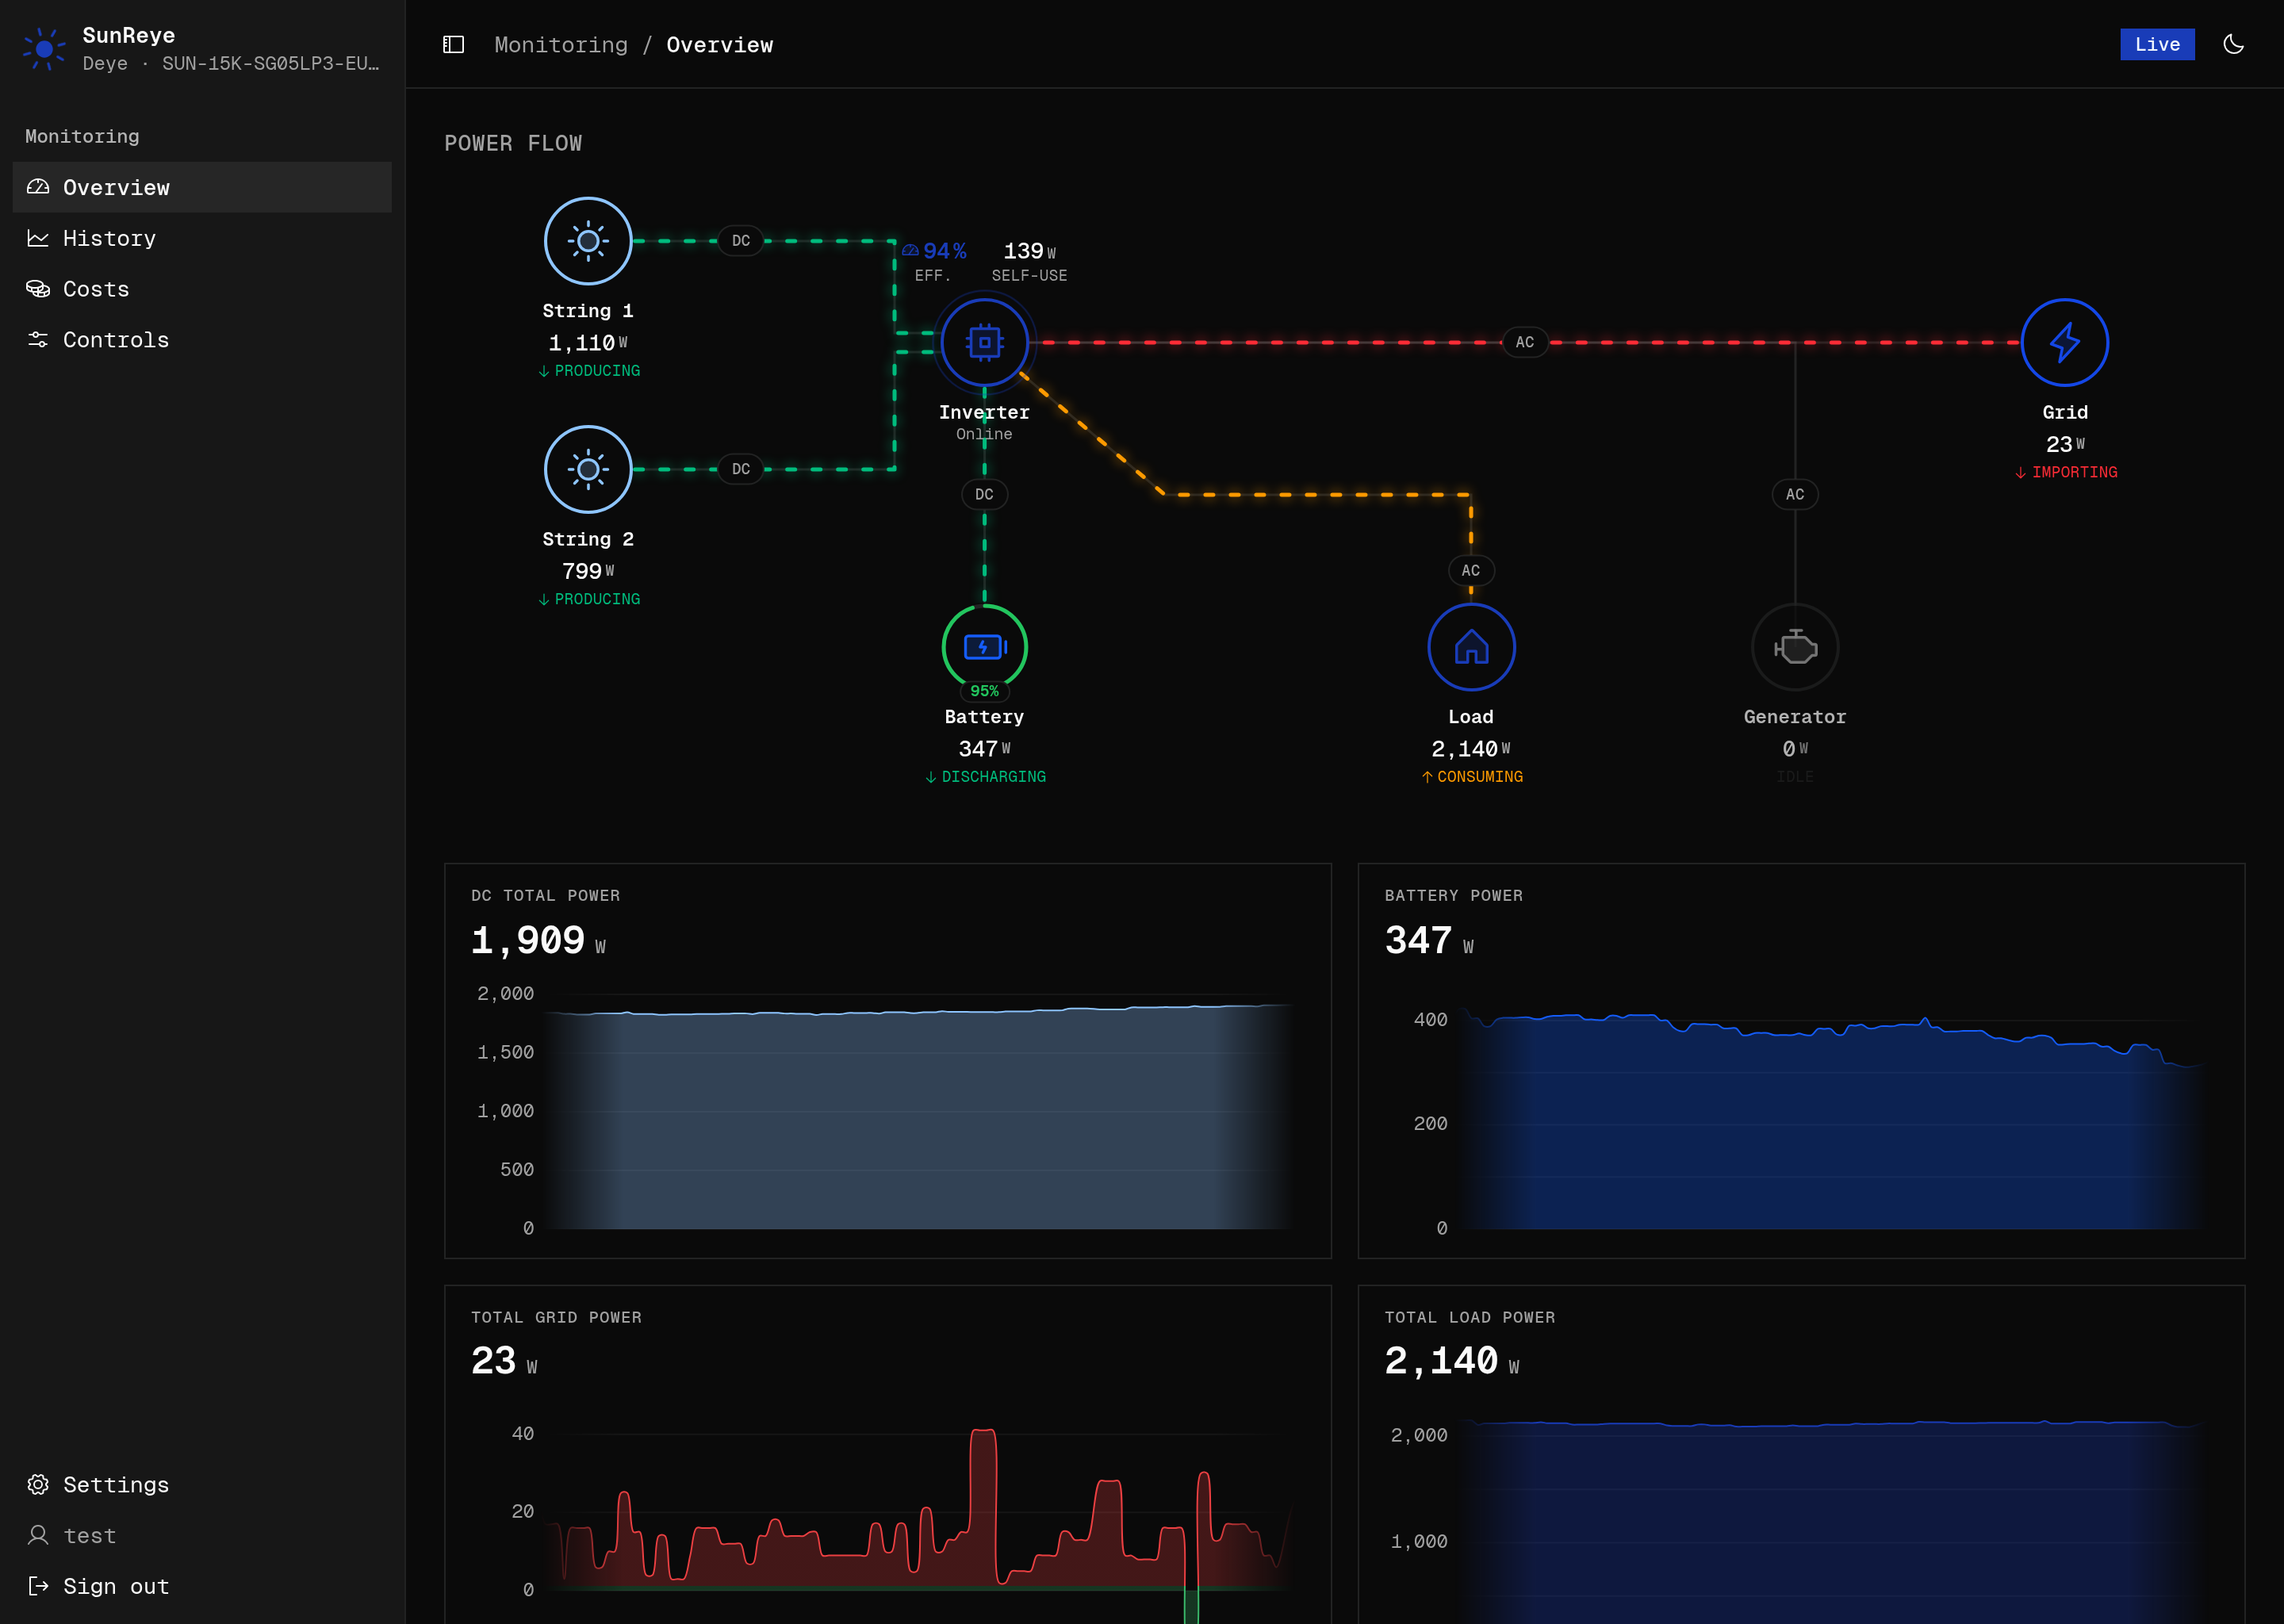
The app shell
Section titled “The app shell”Every screen shares a collapsible left sidebar and a top bar:
- Sidebar — the active inverter’s name, a “Monitoring” nav group (Overview, History, Costs, and — for admins — Controls and Settings), and a footer with the signed-in user and a sign-out button.
- Top bar — a breadcrumb, a live status badge (“Live” / “Connecting…”), and a light/dark theme toggle.
Power flow
Section titled “Power flow”An animated single-line schematic: PV strings ▸ Inverter ▸ Grid, with Battery, Load, and Generator branching off. Only present subsystems are drawn. Each node shows an icon, its live power in watts, and a direction-sensed state (PV “Producing/Idle”, Battery “Charging/Discharging/Idle”, Grid “Importing/Exporting”, …). Animated dashed lines show flow direction, with speed scaling to wattage; the grid line is cost-colored (green when exporting, red when importing). The battery node carries a circular SoC gauge colored red → orange → green.
KPI cards
Section titled “KPI cards”Up to four headline cards — PV total power, battery power, grid power (a diverging red/green split at zero), and load power — each shown only if the metric exists. Every card animates its current value and draws a live sparkline from a rolling 5-minute buffer.
Subsystem sections
Section titled “Subsystem sections”Below the KPIs, one card per subsystem present in the profile:
- Battery — a large SoC readout with charging/discharging state, power, and an animated bar, plus the remaining battery metrics.
- Inverter — status, relay status, DC and AC temperatures.
- Solar · N strings — power / voltage / current repeated per PV string.
- Grid · N-phase — per-phase voltage / current / power (1- or 3-phase).
- Generator and Backup load — shown when the profile has them.
Related
Section titled “Related”- Dig into any metric over time in History & Analytics.
- Change writable settings in Controls.