
Costs & Tariffs
The Costs screen (/costs) turns energy flows into money using the tariff you configure
in Settings → Tariff. It’s analysis over telemetry SunReye already stores
— no extra polling.
Range and headline tiles
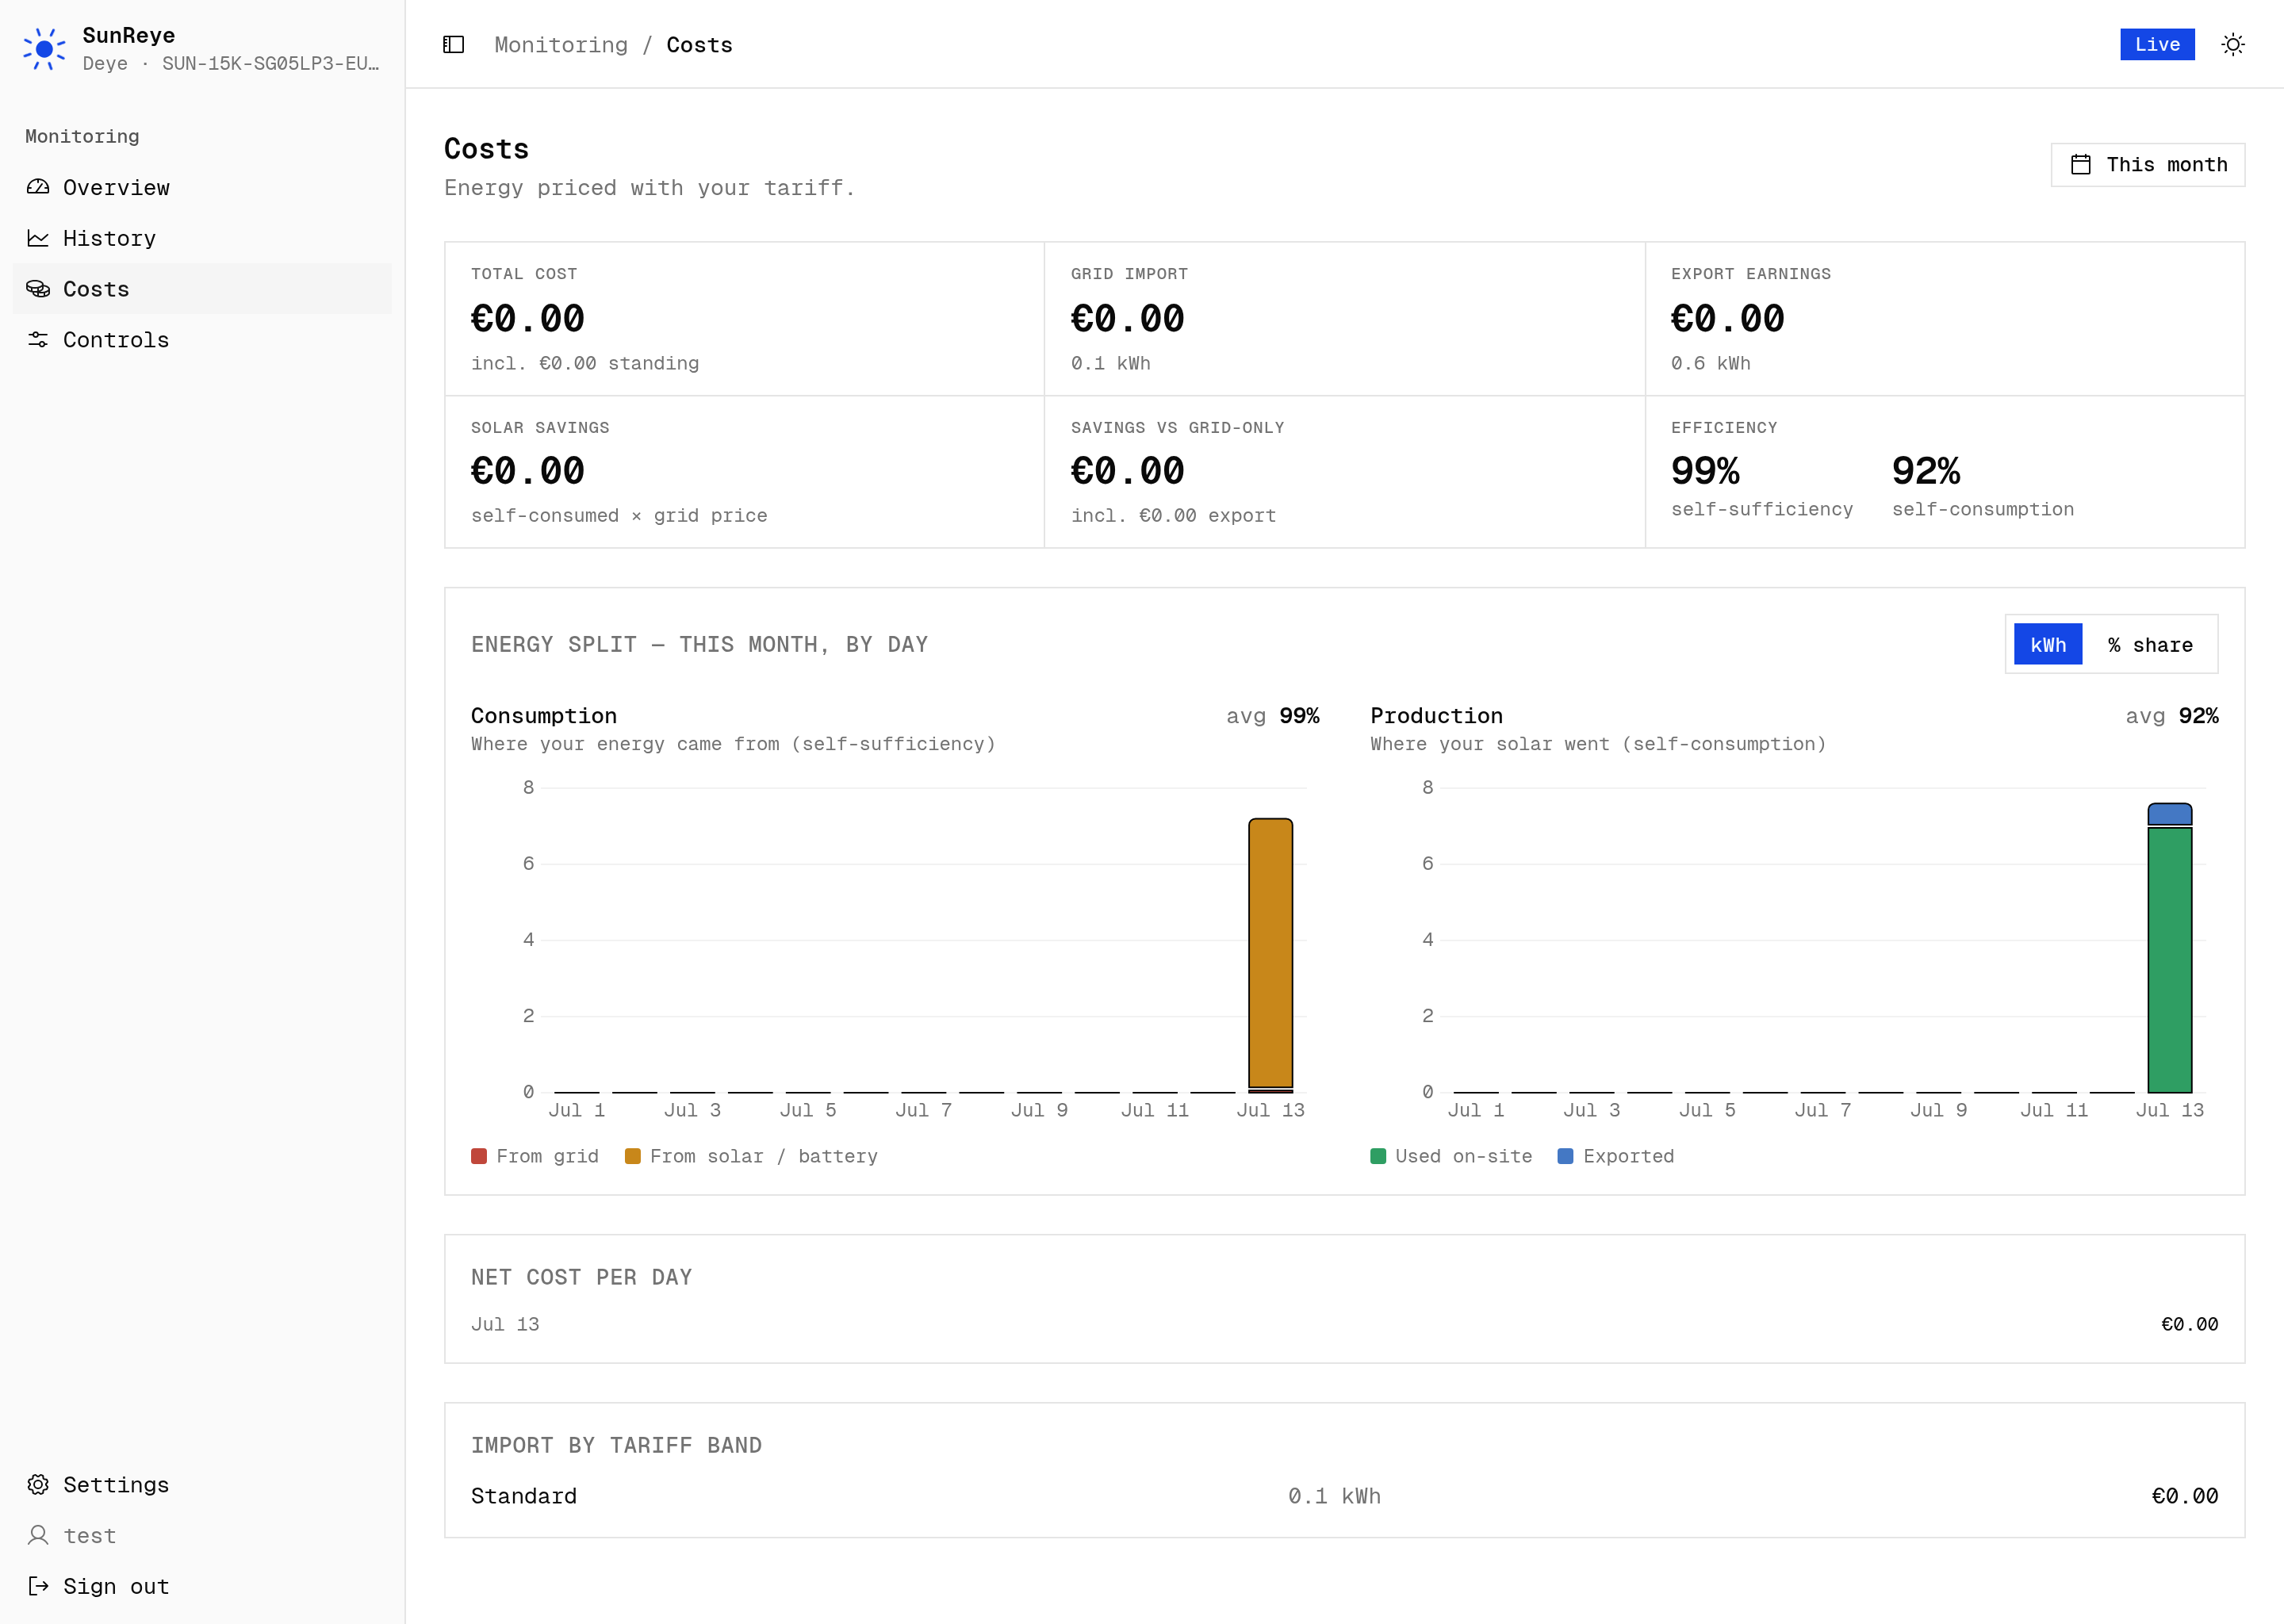
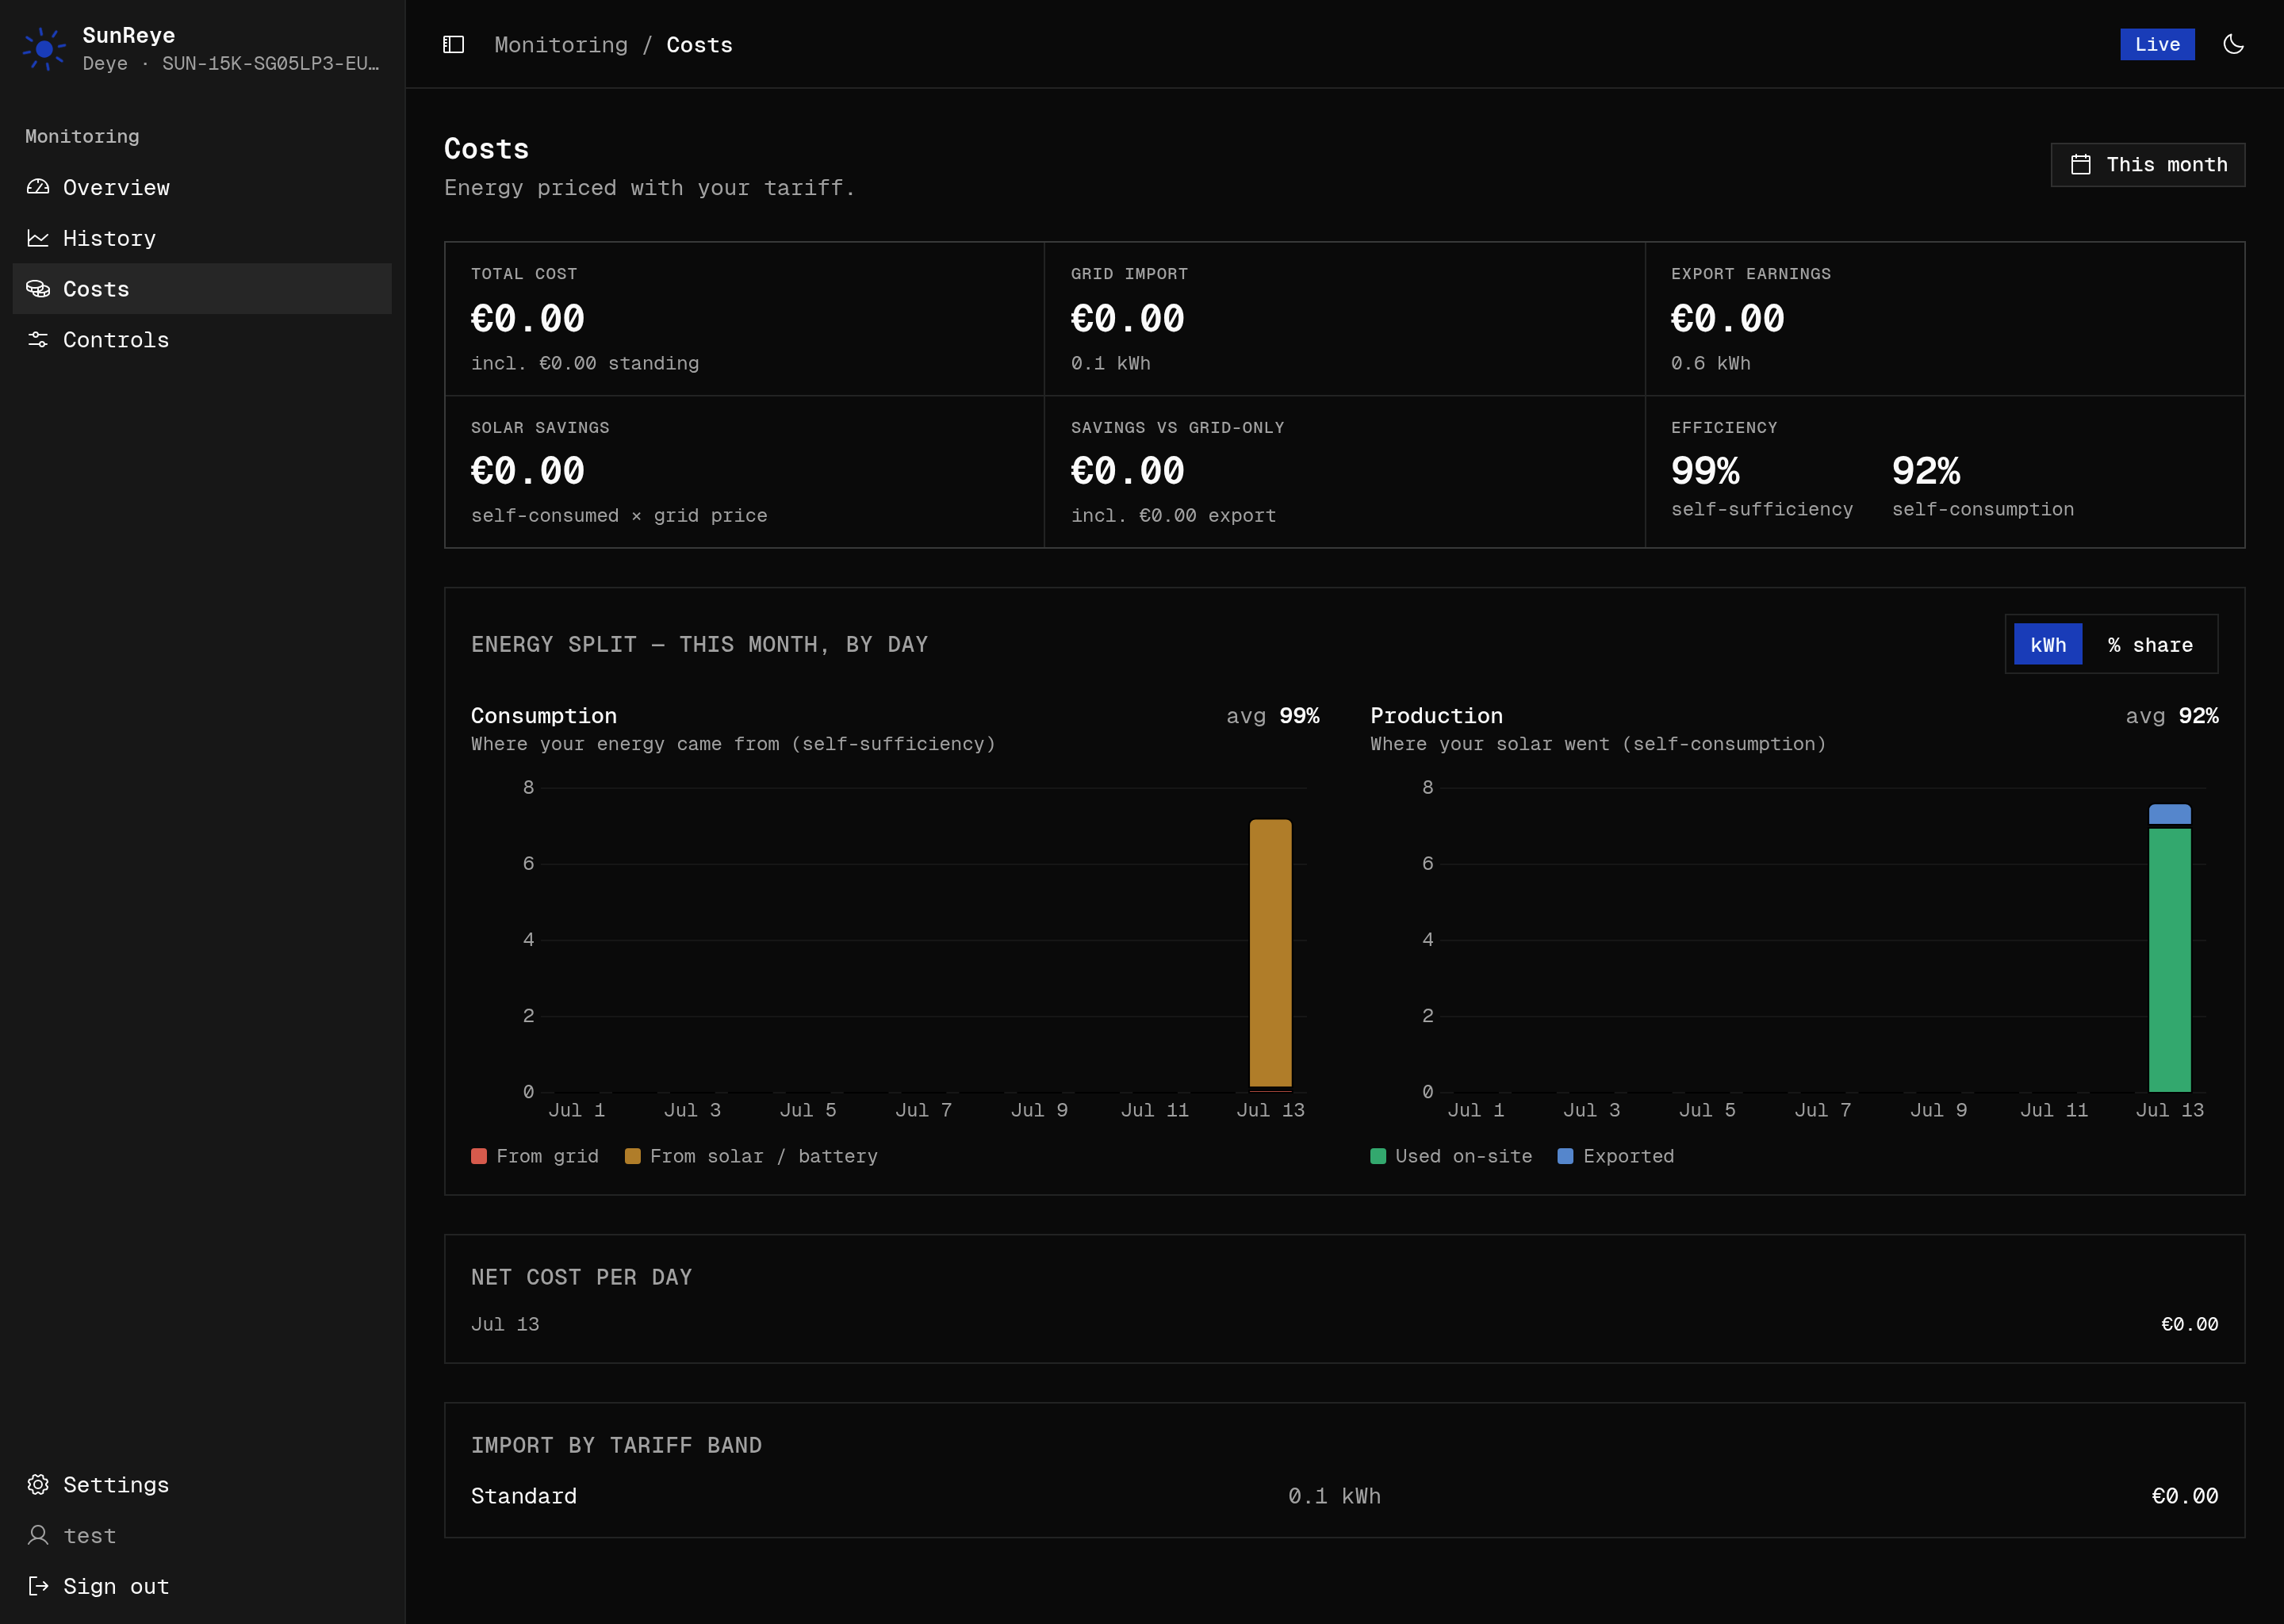
Section titled “Range and headline tiles”A range switcher (Today / This month / This year) drives six headline tiles, formatted in your tariff currency:
| Tile | Meaning |
|---|---|
| Net cost | Total bill including the standing charge (shown as a credit when negative). |
| Grid import | Cost and kWh drawn from the grid. |
| Export earnings | Earnings and kWh exported (feed-in). |
| Savings vs grid-only | What you saved versus buying everything from the grid. |
| Self-sufficiency | % of your load met by solar/battery. |
| Self-consumption | % of your production used on-site. |
12-month energy split
Section titled “12-month energy split”An independent 12-month view (not tied to the range switcher) with a kWh / % share toggle and two charts:
- Consumption — from grid vs from solar/battery, captioned with average self-sufficiency.
- Production — used on-site vs exported, captioned with average self-consumption.
Detail
Section titled “Detail”- Net cost per day — a horizontal bar per day (green bars for credit days).
- Import by tariff band — kWh and cost per time-of-use band, when bands are configured.
Configuring the tariff
Section titled “Configuring the tariff”Set currency, standing charge, feed-in rate, a default import price, and time-of-use import bands (each with a price, hour range, and weekday selection) in Settings → Tariff. Everything on this screen updates from that model.